The Tiniest of Green Shoots – Monday Not Looking Pretty
I want to begin by hoping everyone is staying safe and taking the necessary precautions when venturing out. I spent part of my work weekend mapping out a series of updates and then writing content. As you all know, I am not known for brevity so I thought it would be more beneficial to create a series rather than one very long newsletter. After this piece, I have a short one with some financial planning tips and a big picture one about what the powers that be should be doing. I also have one full of indicators pointing to a strong bottoming process.
In this update, I am going to discuss a few tiny, green shoots that have developed. If you are not familiar with the term, green shoots occur after a big forest fire when the earth is totally scorched. The soil becomes overly rich with nitrogen and then you start to see one tiny piece of green vegetation pop up. Eventually, what used to be a huge forest is now full of green shoots that will grow into very tall trees. As I was conducting my research and analyzing the landscape over the weekend, one common theme kept popping up. As dark as it is or seems right now, stocks are not done going up after this storm passes. I have projections to new highs, possibly in 2021 which I know doesn’t appear to be likely.
Bears Ready for Monday
However, with that piece of really good, long-term news, Monday is setting up to be another ugly day for stocks after the bulls couldn’t hold on to control on Friday. Congress will likely be blamed, but I think the odds favored stocks going down on Monday almost regardless. Given what you are about to read and some fairly wonky data that I won’t go in to, there is a reasonable scenario for finally seeing a low of some sort before the closing bell rings on Tuesday. IF that comes to fruition, I can also make a case for a 10-20% rally over the following two weeks, but that’s putting the cart before the horse. Let’s get through Monday first and see what looks likely.
Getting Outside for Some Therapy
While some people have stayed glued to the news or social media, I have found that getting outside and doing something has been super therapeutic. I do have the luxury of my office being only three miles away and I can come and go as I please. Except for the healthcare professionals in my park, everyone else seems to have closed up. Every day feels like a Sunday.
It felt really good to work out with one of my sons on the baseball field, preparing for his final season of Little League. I just don’t have the heart to tell him that there isn’t going to be a season. It was also nice to hit some golf balls, but I found it very disturbing that so many young people at the range were just hanging around in close proximity and even sharing vaping pens. They just don’t seem to get it and that is causing a bad chain reaction.
As I type this on a sunny, but cool Sunday afternoon in New England, it’s almost impossible to believe what has transpired in such short order. Looking outside it’s like any other Sunday afternoon in early spring. But beneath the surface, WOW!
On Friday, it was no surprise that stocks could not hold on to early gains in hopes of that elusive back to back rally. As I mentioned last week in Looking for a Green Shoot, there are a number of signs to look for that will indicate sellers have been exhausted. The easiest one for you is back to back rally days, something I do think is coming sooner than later.
On a more technical front, we want to see that downside momentum is waning. We may see lower prices, but those should be with less stocks participating and less acceleration. Friday saw an ugly afternoon after the usual bad news on the virus along with Ronin Capital being liquidated. They may be the first, but they won’t be the last.
On the more than 6 days of panic since the decline began, you can actually see the massive selling waves if you sit and watch the market trade. I keep saying that it looks like someone or a group is indiscriminately hitting the sell button at any price just to get out. In reality we are seeing computers executing mass liquidation programs, literally across all major asset classes, stocks, bonds, gold, oil, etc. Eventually, which I think may be this week, sellers will either be fully or at least temporarily exhausted to allow for a sharp, snap back rally.
Here Come the Tiniest of Green Shoots
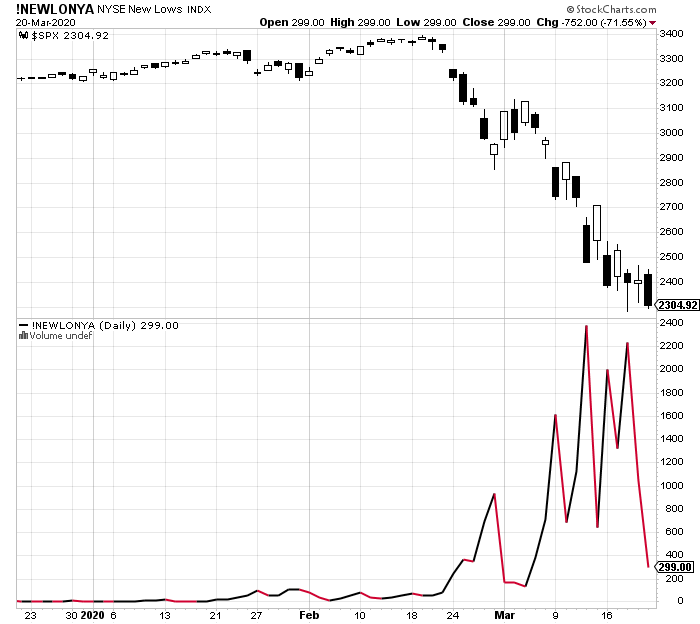
Getting back to Friday’s action, and I don’t want to put too much importance on one single day, there were a number of positives in an otherwise brutal day. Let’s go through them. First, I have the number of stocks making new 52 week lows on Friday as you can see on the far right of the lower chart. The S&P 500 is in the upper chart. There were 299 new lows on Friday versus 2200 last Wednesday and almost 2400 last week. With each successive decline, fewer and fewer stocks are participating. That’s what I mean by a loss of downside momentum. If I am right about Monday being down, let’s see what this number brings.
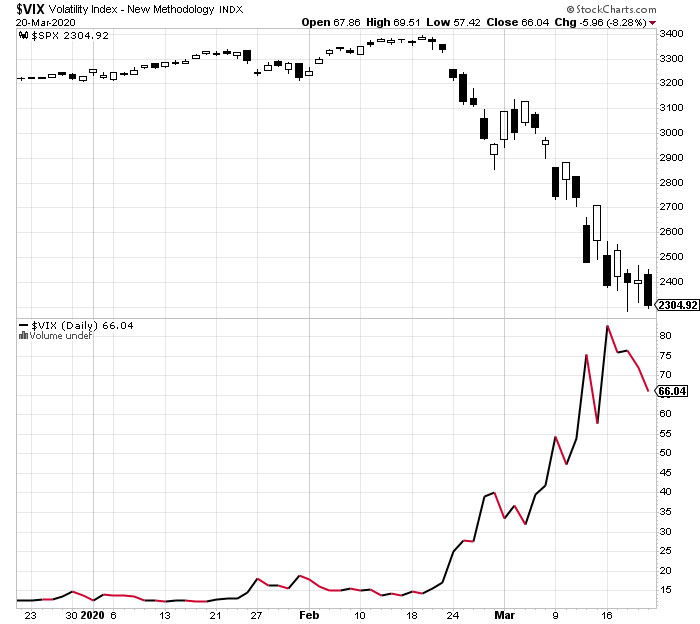
Next, let’s take a look at the Volatility Index (VIX), something I discussed last week. Just like with the number of stocks making new lows, we look for the S&P 500 to go lower with the VIX not exceeding its previous high. That would also show very early signs of selling pressure beginning to ease. As you can see on the lower chart, the VIX has been trending down (less volatility) while stocks continue lower, the tiniest of green shoots.
Continuing on, I often write about one of my favorite canaries in the coal mine, the New York Stock Exchange Advance/Decline Line which measures market participation. Again, it’s only one single day in what has been a sea of red, but last Friday amidst the carnage, there were only 330 more stocks falling than rising. Given the size of Friday’s decline, that number should have been three or four times that amount. Another tiny green shoot.
Below is a chart of TLT which is an exchange traded fund (ETF) that invests in long-term treasury bonds. During stock market meltdowns, this security usually goes up in what’s often referred to as a flight to quality. Looking at the chart below, TLT peaked two weeks ago and has made at least one lower high, so far. Of course, there may be other things at play in the treasury bond market which caused an inital exaggeration two weeks ago. We will see.
 It has been an incredibly tough four weeks for the bulls with relentless selling waves and panics. That’s not easy for anyone but a bear to sit through and watch. However, just like we saw in 2011, 2008 and 1987, when downside momentum began to wane and the tiniest of green shoots started to sprout, the bears’ grip was loosened on each successive decline to new lows. There is a reasonable scenario for the tide to turn this week.
