After a Brief Pause or Pullback, All System Go Again
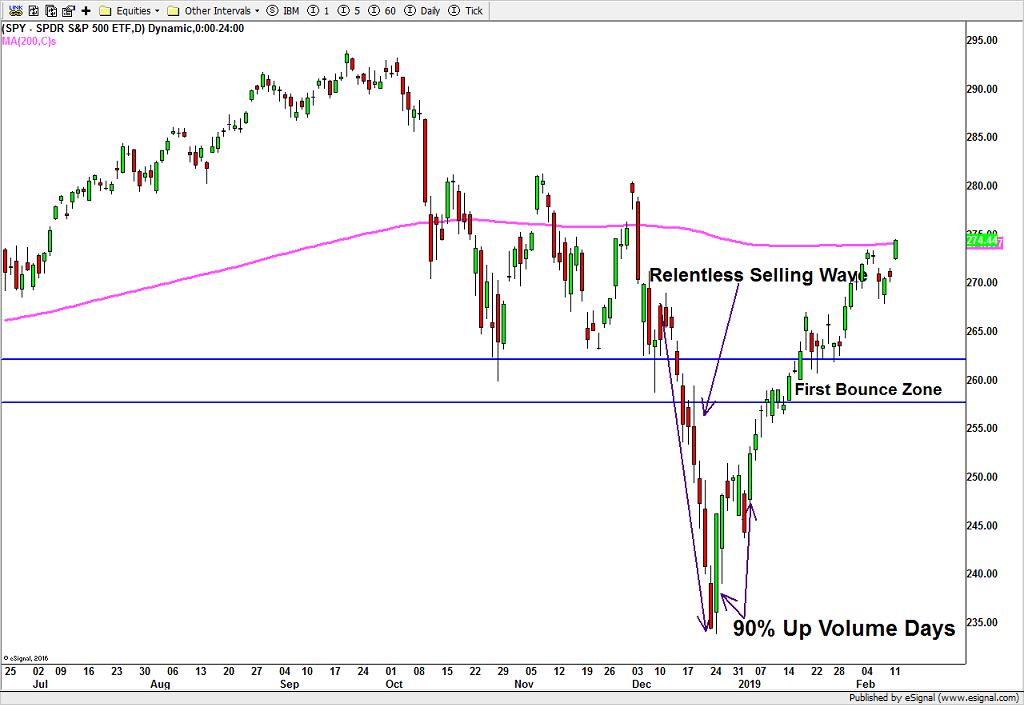
The stock market continues to do very little wrong. Since the Christmas bottom it’s been almost a mirror image of the relentless selling wave I mentioned so often for two months. In fact, as I wrote this, the stock market has just recovered 100% of the losses from that final, nasty sell off. Recall that the almost unprecedented wave was where stocks closed lower than where they opened for 10 straight days, likely not seen since the 1930s. Additionally, stocks closed in the lower half of their daily range all 10 of those days, which has not likely been seen since the 1930s although without intra-day for the 1970s, it is possible this behavior occurred then. The bottom line as I discussed many, many times, that was one heckuva selling wave in December.
Since the Christmas low, stocks have bounced very nicely in a complete reversal of behavior and even past the zone I first forecast on December 21. I recall being countered by other pundits that stocks wouldn’t even see my zone by April. The selling was supposedly too widespread and damaging. So many pundits, analysts and members of the media were calling for a new bear market. While that final relentless selling wave saw mostly red days on the chart below, the rally since has been mostly green days, meaning that stocks have closed higher than where they opened.
Since the Christmas trough we saw two separate days where the percent of volume in advancing stocks was greater than 90%. That’s very powerful and usually leads to extended stock market gains. Additionally, there were a number of “thrusts” seen which really means that the number of stocks going up over a certain time period completely and utterly overwhelmed the number of stocks going down. In other words, more confirmation that the Christmas bottom was a major one.
Finally, the pink line on the chart below represents the average price of the last 200 days, more popularly known as the 200 day moving average. It’s a widely viewed way to define the long-term trend. Sometimes, because many managers act on this for some odd reason, price can bump up or down against it and then pause or move in the opposite direction for a spell. Computerized trading programs love to push markets around popularly watched areas like the 200 day moving average and force others to pile on.
I mention all this about the pink line because the S&P 500 just hit that area on Tuesday as you can see below. I would venture to guess that the computer algos had a hand in this. More than likely, stocks are about to either pause or mildly pullback 1-2%.
All of the aforementioned can be seen in the chart below.