Yet Another Sign of Confirmation
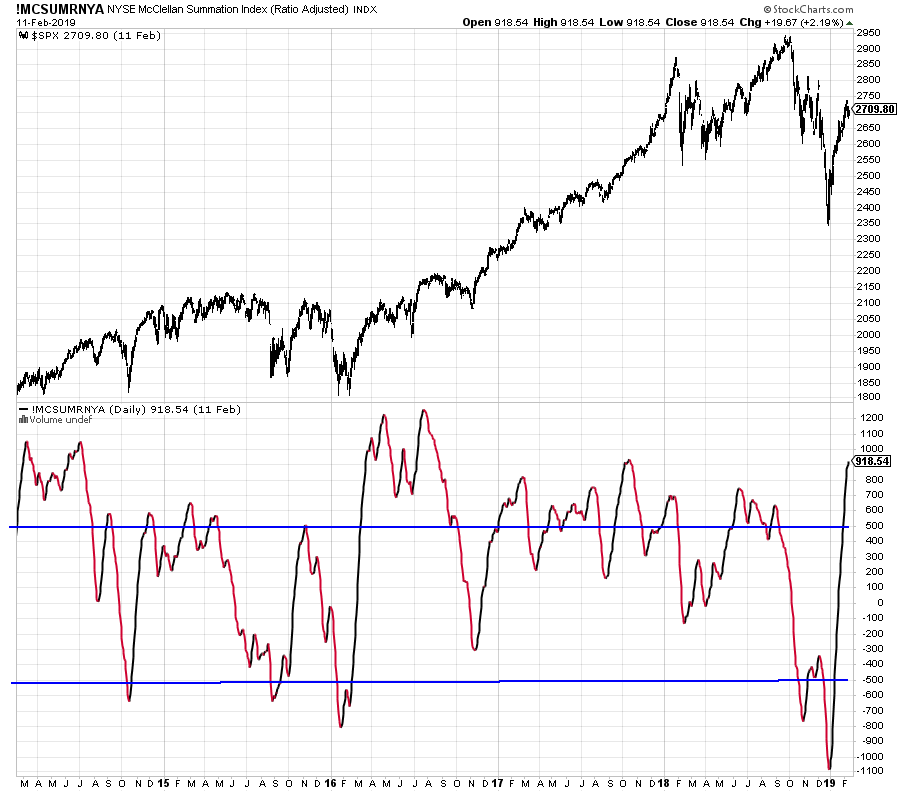
The chart below is one I first learned about from my good friend, Tom McClellan. Tom and I have known each other for 25 years and I always enjoy our email threads regarding research. Below you can see the the S&P 500 in the top chart and one of Tom’s indicators in the bottom which is called the McClellan Summation Index. How it is created doesn’t matter, only that it’s a measure of thrust and participation in rallies and declines.
What I want you to notice are times when it falls below -500, depicted by the lower blue horizontal line. That indicates widespread and steady selling for a period of time. Obviously, price normally follows suit. After becoming sufficiently oversold around -500, a rally will develop sooner or later. Once the rally gets going, the key is to get this indicator above +500. The higher the better. Essentially, doing so indicates an “all clear” or like a rocket ship, it has achieved escape velocity where it won’t fall back to earth.
Nothing is foolproof. All of the models and indicators I use generally work the majority of the time. The more things that line up, the stronger the conviction I have. In this case, the indicator has rocketed all the way to +918, way above the +500 line in the sand. In the simplest terms according to this indicator, the rally is for real and here to stay.