Bull Markets Do NOT End This Way
*NOTE: I began this piece as my regular Friday blog post as a follow up to a tweet I sent last night. The more I wrote, the more I wanted to say. That turned into more of an Analysis 101 piece which I am distributing to everyone. It’s also one very important piece in my canaries in the coal mine which I hope to have out next week.
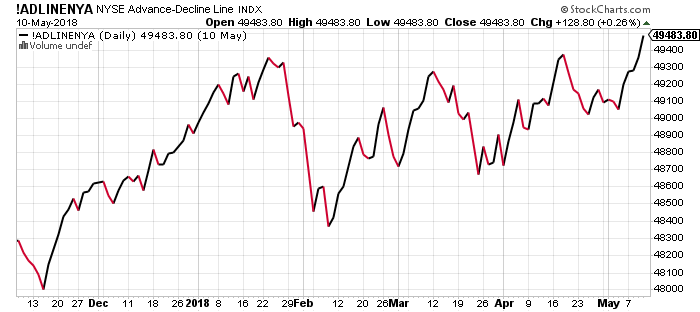
One of my favorite long-term indicators scored an all-time high on Thursday, the New York Stock Exchange Advance/Decline Line (NYSE A/D Line). Before you stop reading, start yawning and move on to another topic, this is one of the better indicators of long-term health for the stock market. For those not familiar, every day, we look at the net number of stocks going up or down on the NYSE. If there are 2000 stocks up and 1000 stocks down, the net number is +1000. From there it’s just a cumulative line as you can see below.
The NYSE A/D Line is valuable because it tells you what’s going beneath the surface of the major stock market indices. Since most of the major indices are weighted by market capitalization or value, they can often mask underlying problems if the biggest stocks are doing fine.
Normal behavior over time shows that the NYSE A/D Line and the major indices like the S&P 500 generally move in the same direction with similar peaks and valleys. When the major stock market indices make new highs but the NYSE A/D Line does not, that’s where bulls should begin to worry. If you look at the chart above, the exact opposite is happening. The NYSE A/D Line is at all-time highs, but stocks are still well below those highs. That’s typically a good sign for further strength in stocks over the intermediate-term.
Bull markets usually end when the NYSE A/D Line peaks and rolls over to the downside long before the major stocks indices do. A good analogy would be that the generals are all still battling but the enlisted men have all died. Or, the foundation of the building is full of cracks and is crumbling but the penthouse looks flawless with million dollar art and furniture.
If you look at all of the bear markets since 1955, which I arbitrarily used as a 20% closing decline in the S&P 500 from an all-time high, you find 9 beginning on these dates:
8/3/1956
12/12/1961
2/9/1966
11/29/1968
1/11/1973
11/28/1980
8/25/1987
3/24/2000
10/9/2007
I could have also added 7/16/1990 and 7/17/1998 as those declines were just short of 20%, but it just adds more credence to the outcome. In every single case except for 1968, the NYSE A/D Line topped out before the S&P 500 although 1966 was only three weeks. 1990 and 1998 did as well. The average lead time was 221 market days or about 10.5 months.
Again, with the NYSE A/D Line scoring an all-time high, that has traditionally insulated stocks from a bear market for at least three months but as long as 21 months. It doesn’t mean that stocks can’t fully correct, but that weakness should definitely be bought. While the masses were exclaiming the end of the bull market during the February decline, I have pounded the table at every juncture that regardless of the decline, fresh all-time highs were coming, at least to Dow 27,000, partly because this indicator peaked with stocks in January as it usually does during healthy bull markets and has not yet diverged.
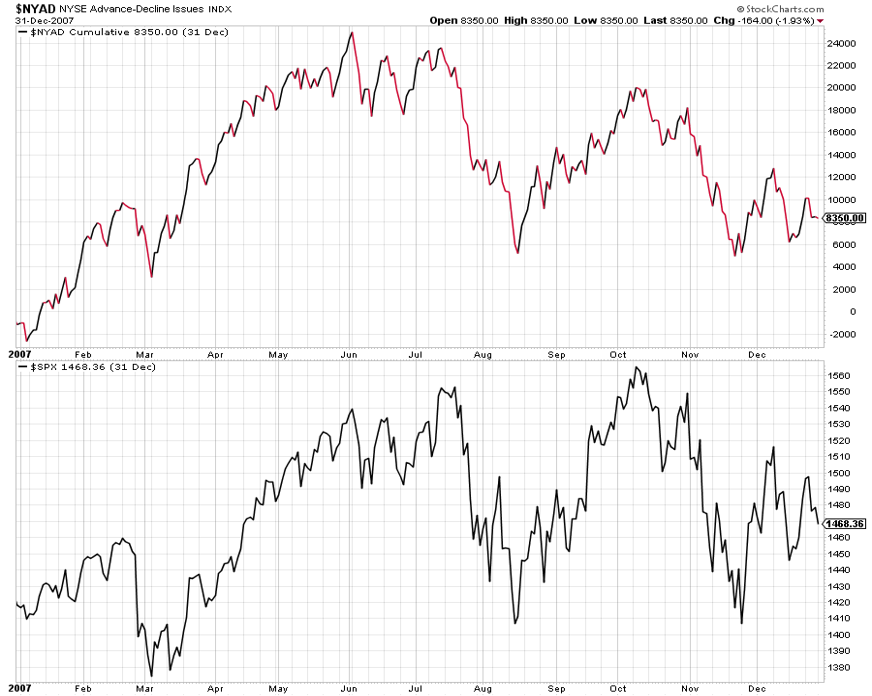
For those wondering, in 2007 as you can see below, the S&P 500 peaked in October, but the NYSE A/D Line topped out in June, a full four months lead time.
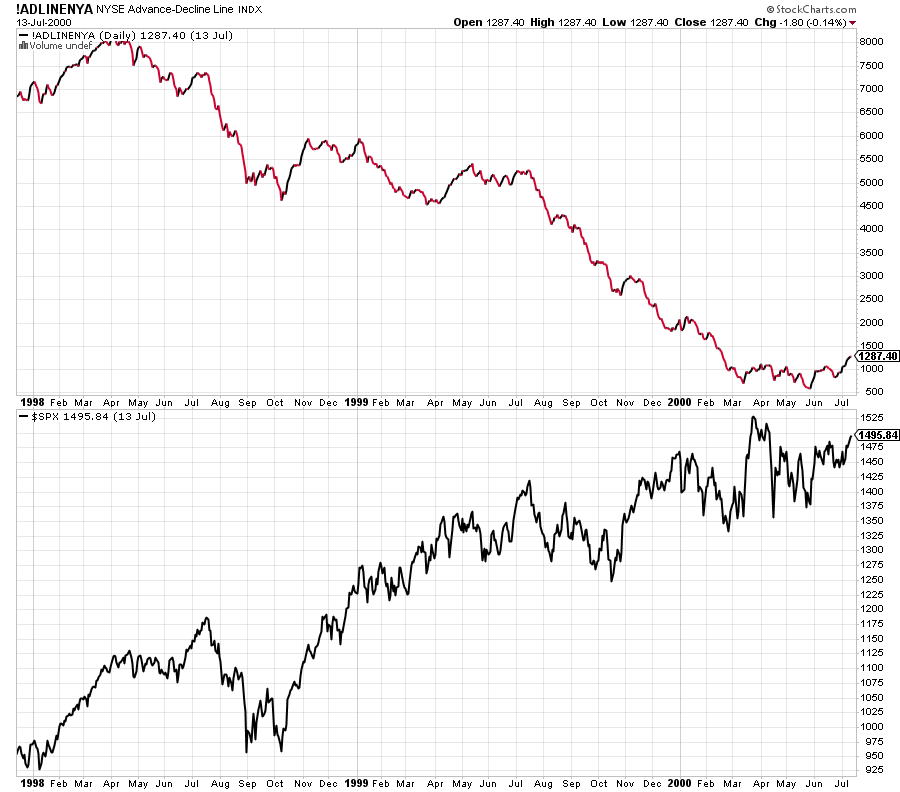
The previous bear market from 2000-2002 saw the NYSE A/D Line peak in mid-1998, a full 21 months before the major stock indices did as I show below. In fact, by the time the Dow, S&P 500 and NASDAQ 100 topped out in March 2000, the vast majority of stocks had already been declining for almost two years. If it wasn’t Dotcom and tech, it wasn’t going up.
While this is a very powerful long-term tool, it is certainly not foolproof nor infallible. It will give warnings that later get corrected without much of a decline in stocks. The NYSE A/D Line will decline as stocks go up, but then regather itself and make new highs down the road. That’s why I use it in conjunction with other tools or canaries in the coal mine.
Finally, naysayers like to argue that the NYSE A/D Line is full of too many non-operating companies which behave more like bonds and therefore the results get skewed. While they are correct, research concludes that including the bond-like proxies is a much better indication of overall stock market healthy than just using the NYSE A/D Line for common stocks only.
