Panic Buying Seen Off January Low… Will It Matter???
On January 22nd and January 29th, an extremely rare occurrence was seen in the stock market; something that had only happened 9 times since 1971. Over a span of five days, there were two days where 90% of the trading volume on the New York Stock Exchange took place in stocks that were up on the day.
90% volume days are nothing new to analysts. They have been watched since the days of Jesse Livermore in the 1920s. However, two so close together is a rare feat and something that should be watched very closely. Pre-2007, these events, most commonly known as breadth volume thrusts, were as rare as a pink rhino and always led to a new or refreshed bull market. Starting in 2007, however, these events have been seen roughly once every year and a half and their behavior has changed somewhat.
What changed?
In July 2007, the SEC eliminated the uptick rule which had been in place since the 1930s to prevent short sellers from piling on a stock that was accelerating to the downside. (Short selling is the exact opposite of buying. One sells a stock they technically do not own in hopes of buying it back at lower prices.)
On the surface, I would have thought that these events would occur more frequently after the SEC eliminated trading stocks in fractions in 2001 and went to full decimalization. This change basically eliminated stocks closing unchanged on the day. Upon deeper analysis, the real culprit beginning in 2007 after the uptick rule was eliminated was the much maligned algorithmic or high frequency trading. This acutely hyper and ultra short-term computer driven trading exacerbates moves, especially on the most lopsided trading days which just happen to be on the days in question.
Getting back to the original topic at hand, the breadth volume thrust, let’s dive in to the previous 9 occurrences to see similarities and differences. In 1971, it hit as stocks emerged from a bear market and never looked back over the ensuing few quarters. The drawdown or paper loss was 0.

It took 11 years for the next thrust to appear in 1982, again as a new bull market was launching. As with 1971, the market never looked back and there was not any drawdown seen.

Two years later in 1984, there was another thrust as stocks were emerging from a bear market. As with the previous two occurrences, stocks just powered ahead without any paper loss at all.

January 1987 was next and that makes it four for four with stocks never looking back although this time, the market wasn’t emerging from a bear market. A subtle change took place.

During the entire, historic bull market of the 1990s, there was not a single thrust. Not after the 1990 bottom nor the 1998 one. Even coming out of the 2000-2002 bear market, there were no thrusts. It wasn’t until the uptick rule was eliminated in July 2007 did we see another thrust. This one occurred after a routine 10% correction in stocks.
Unlike all previous thrusts, stocks saw what I will call an immediate pullback or quick bout of weakness. Additionally, stocks did see a drawdown or paper loss over the following few quarters. In this case, it was 13.57% and the thrust turned out to be a failure in hindsight after stocks rolled over for good in May 2008.

A little more than year later in November 2008, another thrust took place. I vividly remember this one as it looked to me like stocks were finally bottoming. It was the perfect thrust like we saw in the 1980s, or so I thought. But as with 2007, stocks saw the immediate pullback before heading higher over the short-term. Additionally, the maximum paper loss was a painful 23% over the next quarter.

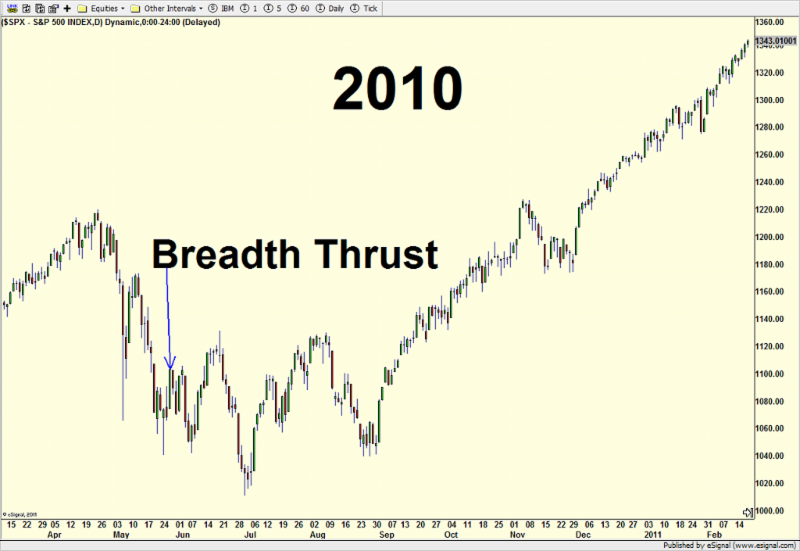
After the Flash Crash in early May 2010, the breadth volume thrust hit again. And as we saw with all thrusts since the SEC eliminated the uptick rule in 2007, there was an immediate pullback and stocks did not run away. There was also a 7.34% drawdown before the bulls were handsomely rewarded.
Following an almost 20% waterfall decline during the summer of 2011, the thrust was seen again in August. As with the previous three cases, there was an immediate pullback and stocks did not run away unfettered. Bulls also had to tolerate a modest 6.23% drawdown before being hugely rewarded.

Finally, in 2012 after a less than 10% decline, a thrust hit in very timely manner and stocks never looked back, nor was there an immediate pullback.

This brings us to 2016 and the current thrust, which occurred after an almost 15% correction in stocks. On the surface, this reminds me most of 2011 so far. With stocks declining on Tuesday, the immediate pullback scenario looks to be in play, but it’s too early to tell what kind of drawdown may be seen. If 2011 continues to play out, there should be some modest upside shortly, followed by the drawdown and then a better rally.

What was an ironclad, close your eyes and back up the truck buy signal has morphed as the markets have evolved. Clearly, the elimination of the uptick rule and proliferation of computer driven, algorithmic trading has reduced the immediate effectiveness of the the breadth volume thrust. However, it should still be followed closely with the post 2006 behavior being the new norm.
As I was writing this article, an email came in from Rob Hanna who runs Quantifiable Edges newsletter with the same research thought. Thanks Rob, as always, for sharing!
If you would like to be notified by email when a new post is made here, please sign up HERE.
